NDVI vs. EVI2 vs. NIRv: Which Index Should You Trust (and When)?
2025-08-18 · 6 min read · Sentinel-2 · Landsat · Indices
TL;DR: NDVI is universal and simple but saturates at high biomass and is sensitive to soil and thin haze. EVI2 is more stable when backgrounds and aerosols vary and stays more linear at high canopy. NIRv multiplies canopy brightness by greenness and often tracks biomass and productivity best across scales. For crop monitoring a solid default is EVI2, keep NDVI for legacy comparability, consider NIRv for productivity modeling. Whatever you choose, keep band alignment and processing level consistent across dates.
What these indices actually measure
Vegetation indices map how plant canopies interact with red and near-infrared light. Chlorophyll absorbs red strongly, mesophyll structure scatters NIR, and the contrast between the two carries information about greenness, leaf area, and canopy structure. Three indices dominate practical workflows.
NDVI uses a simple contrast between NIR and Red: NDVI = (NIR - Red) / (NIR + Red). It is easy to compute and compare across sensors, which explains its long life in science and operations. NDVI can flatten at high leaf area and is sensitive to bright soils and thin haze that raise Red or depress NIR modestly. Read more: Monitoring Vegetation with Red and Photographic Infrared (Tucker 1979)
EVI2 is the two-band form of the Enhanced Vegetation Index: EVI2 = 2.5 * (NIR - Red) / (NIR + 2.4 * Red + 1). It drops the blue band that classic EVI uses and keeps correction terms that damp soil background and small aerosol effects. In many cropland time series EVI2 stays responsive where NDVI begins to saturate. Read more: Development of Two-band EVI2 (Jiang, Huete, Didan, Miura 2008) and Overview of MODIS Vegetation Indices and EVI behavior (Huete et al. 2002)
NIRv multiplies near-infrared reflectance by NDVI: NIRv = NIR * NDVI. This construction emphasizes the fraction of NIR that is attributable to vegetation rather than background, which often tracks absorbed photosynthetically active radiation and gross primary productivity across sites and scales. Read more: Canopy Near-Infrared Reflectance and Photosynthesis, NIRv (Badgley, Field, Berry 2017)
Sensor bands and where to compute
On Sentinel-2 the common choice is B8 for NIR at 10 m and B4 for Red at 10 m. On Landsat 8 and 9 use B5 for NIR and B4 for Red. If you prefer the Sentinel-2 narrow NIR band B8A at 20 m, resample consistently and keep inputs co-registered before any band math. Indices should be computed on aligned rasters after resampling, not before, and denominators should be clamped to avoid division by very small numbers.
Surface reflectance at the bottom of atmosphere is usually the right input when the aim is cross-date comparability and physical interpretation. Top of atmosphere reflectance can be acceptable for time-critical monitoring if you keep your processing level fixed and compare changes rather than absolute levels, but you should expect more variability in hazy or low-sun conditions.
When to prefer each index
If your fields or stands reach dense canopies during the season NDVI will often plateau as the Red band saturates and the NIR response flattens relative to added foliage. EVI2 keeps responding longer in that regime because the denominator tempers Red and soil contributions. In early season or sparse cover NDVI can jump around on bright soils because small Red or NIR changes translate into large ratios. EVI2 reduces that sensitivity, which tends to produce steadier emergence and early growth curves.
If you care about biomass and productivity at parcel or landscape scale NIRv is a strong candidate. Because it blends canopy brightness with greenness it correlates well with absorbed light and carbon uptake in many ecosystems, provided your radiometry and geometry are handled consistently. It is still an index derived from reflectance, so strong anisotropy or view and sun angle swings can move it around if left uncorrected.
If your priority is legacy comparability across archives and sensors NDVI remains valuable. Many regulations, dashboards and historical baselines expect NDVI. A practical pattern is to continue publishing NDVI for continuity and compute EVI2 alongside it to improve sensitivity and robustness for day to day decisions. When you build models of production or vigor that need a closer link to photosynthetic activity, add NIRv to the feature set and evaluate it against your ground truth.
Typical failure modes and how to read them
Thin cirrus or aerosol haze depresses NIR relative to Red, which lowers all three indices to some degree. EVI2 will usually drop less than NDVI for the same haze conditions because of its denominator. Bright bare soils can inflate NIR and Red together and pull NDVI toward intermediate values even when vegetation is absent. EVI2 reduces that effect but does not remove it completely. In very high biomass NDVI values cluster near the upper bound, which makes small physiological changes harder to see. EVI2 and red edge indices such as NDRE are more informative there. Over water or very dark targets, negative or low values are common and expected. In snow and mixed snow cloud conditions, all indices can mislead unless the scene is well screened for those materials, so caution is warranted when interpreting winter excursions.
Implementation notes for Sentinel-2 and Landsat
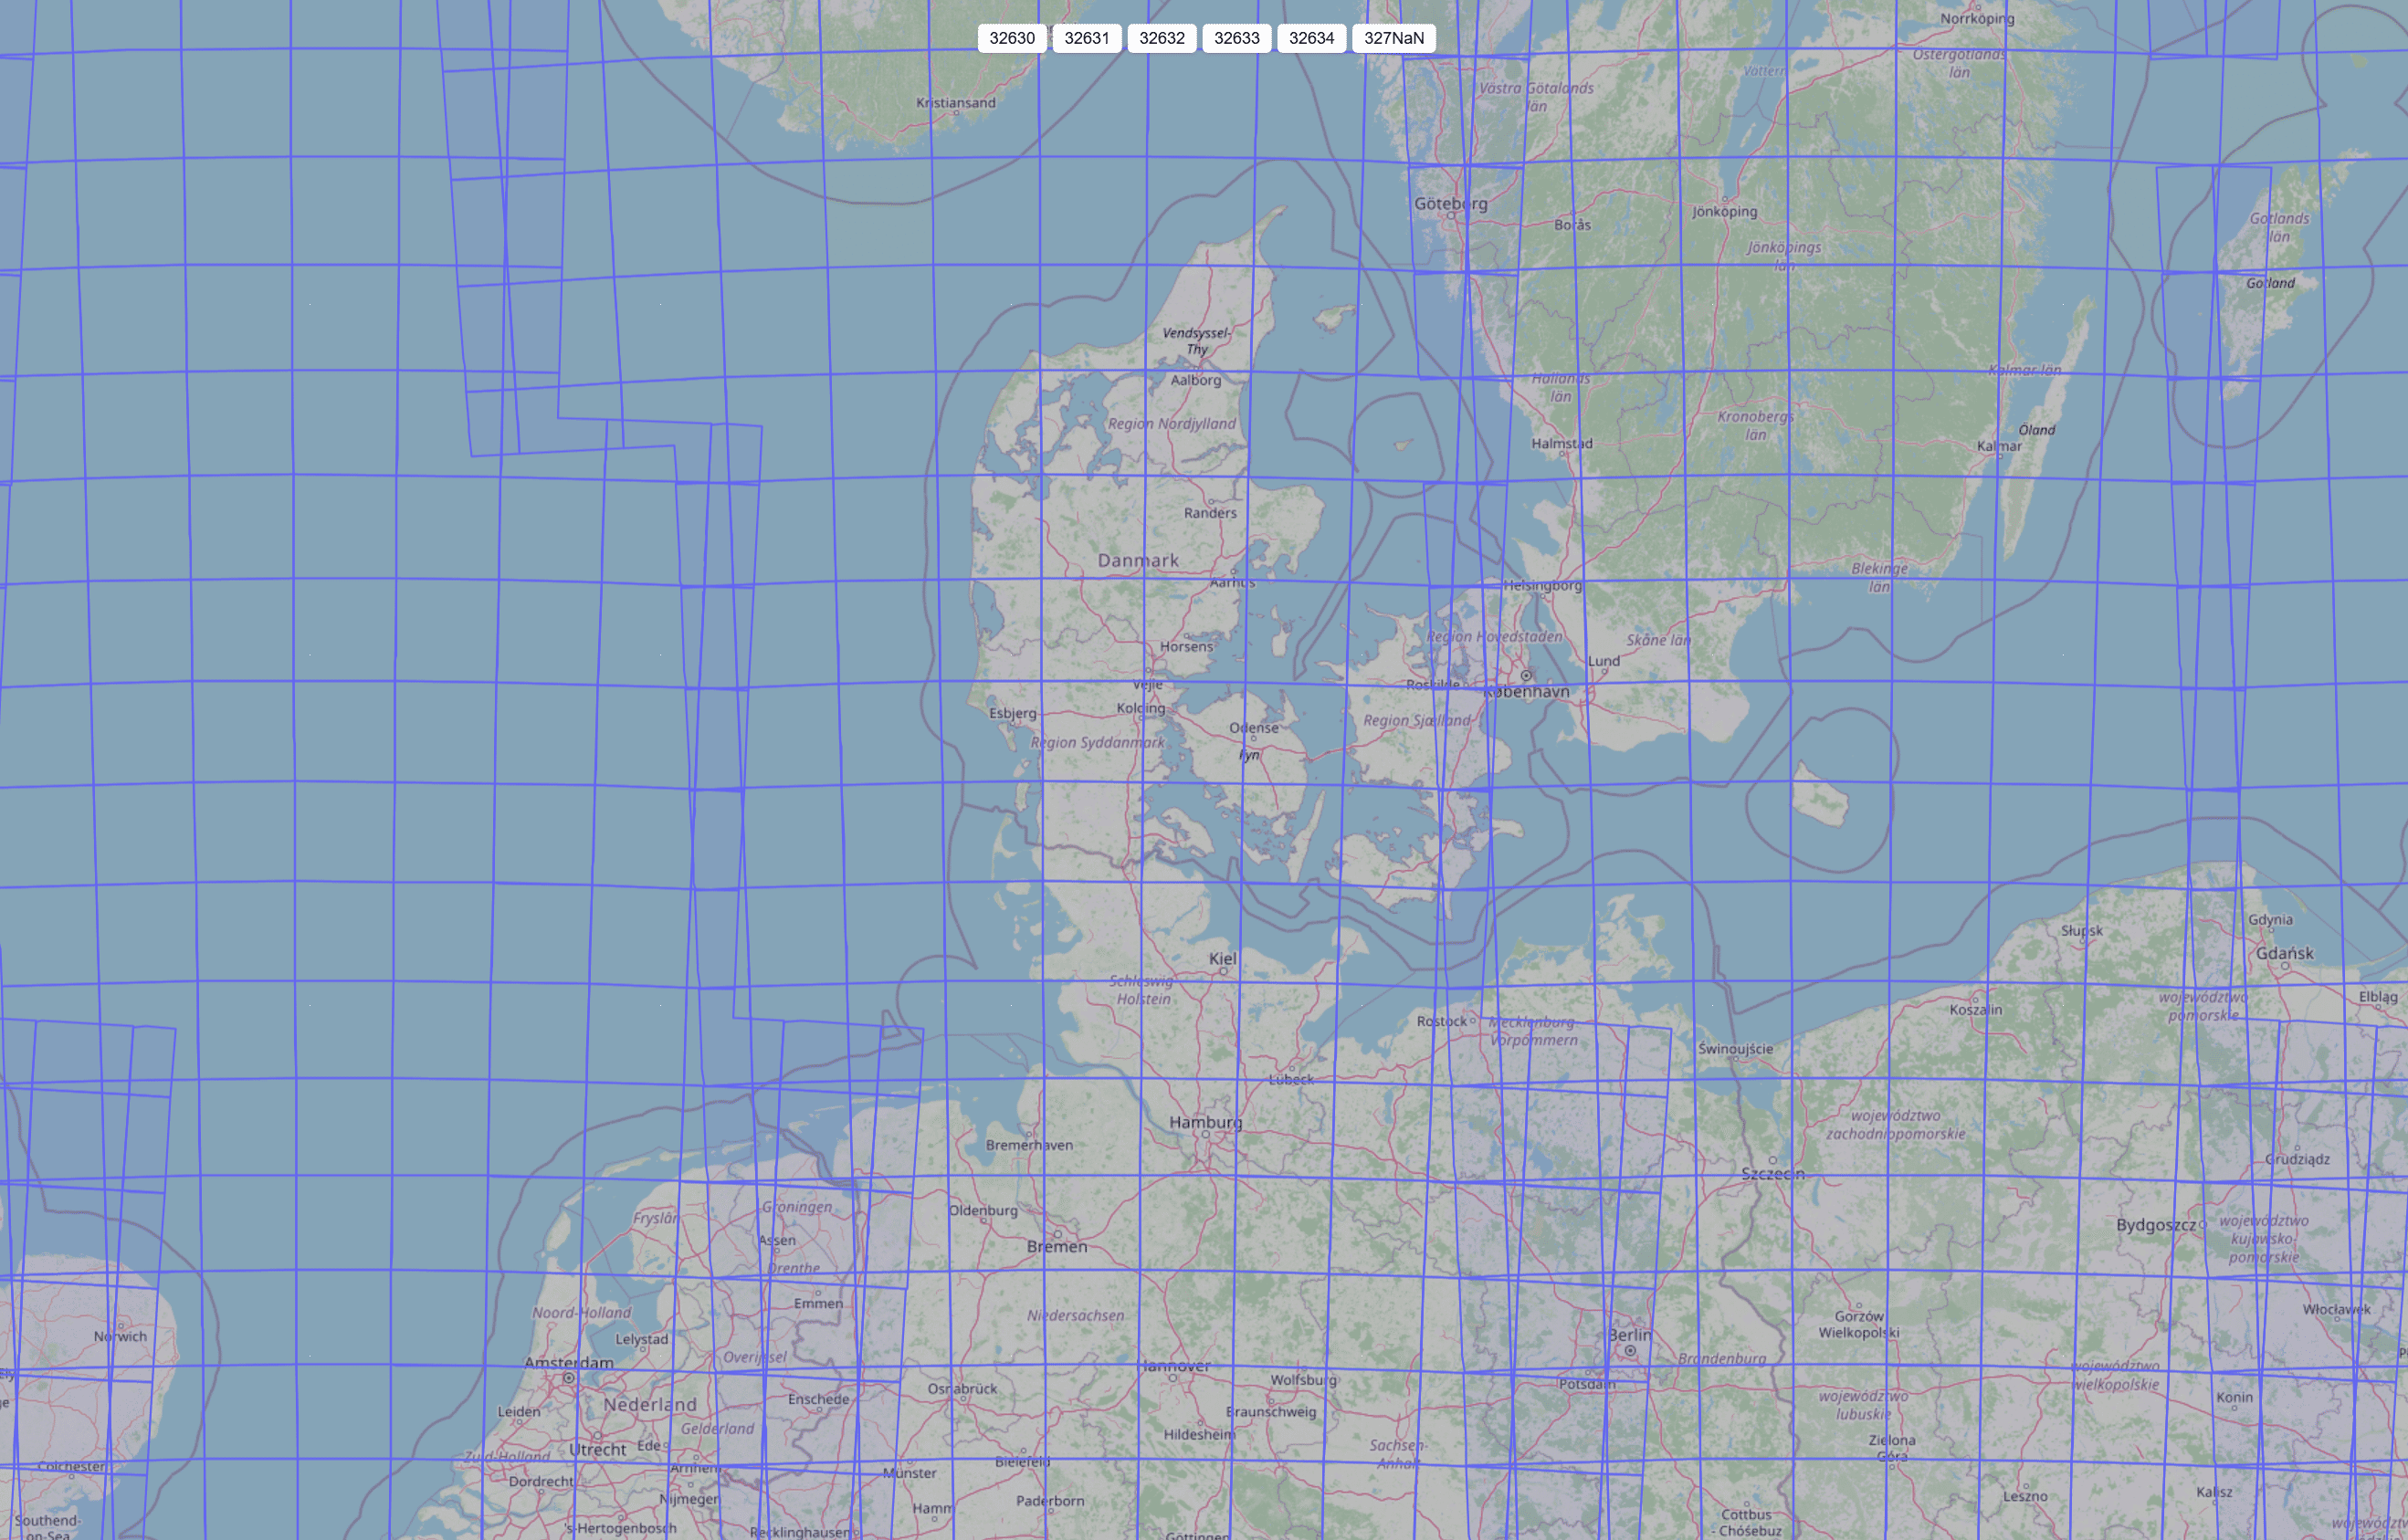
Keep bands at the same resolution and on the same grid. For Sentinel-2 that usually means computing NDVI, EVI2 and NIRv from 10 m B8 and B4. If you mix B8A at 20 m, resample with care and apply the same choice consistently through the series. For Landsat 8 and 9 compute from B5 and B4. If you analyze large regions that span multiple UTM zones, compute indices per tile in the native UTM reference, then merge parcel statistics at the table level. This avoids repeated resampling and the off by one pixel shifts that can creep into small fields.
ClearSKY in practice
If you want indices alongside multispectral data, set the Bandnames field in your composite request to include the needed source bands and normalized difference indices in one go at no additional cost. Use all to receive the full Sentinel-2 style stack, or specify exactly what you need, for example B8,B4,[B8_B4] to return NIR, Red and a ready to use NDVI layer in one GeoTIFF. EVI2 and NIRv are not normalized difference forms, so include their source bands in the same response, such as B8,B4 and optionally B8A, and compute them immediately and consistently in your pipeline. All ClearSKY deliveries come at 10 m resolution across the stack. Bands that are natively 20 m are provided at 10 m using deep learning super resolution or resampling, so your indices line up per pixel without extra preprocessing on your side.